In this blog we’ll review monitoring Microsoft and Office 365 services in eG Innovations Enterprise.
The CribNotes series of articles are meant to provide quick visual overviews of system features and capabilities, combined with condensed technical notes, steps and prerequisites that will help you gain an understanding of what you need to accomplish a similar solution.
To skip to the bottom to see more screenshots of these features, click here. To review basic setup and configuration tasks, simply keep scrolling.
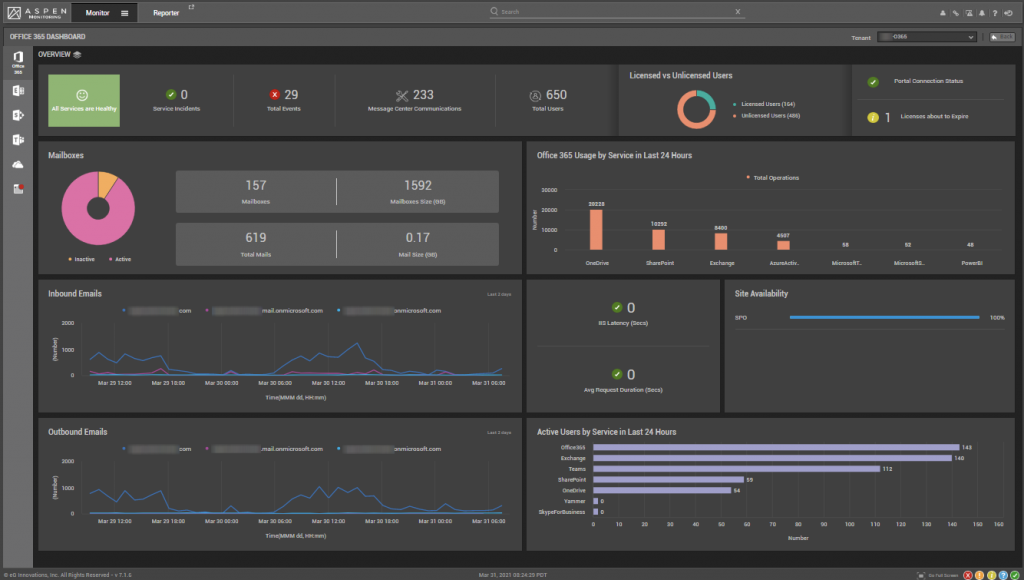
Prerequisites
- An eG Agent running on a Remote Agent host inside your environment
- For more information from eG: https://bit.ly/3sNiLcl
- Access to a Global Administrator account for your M365 Services
- Basic authentication for WinRM should be enabled on the eG Agent host
- For more information from eG: https://bit.ly/3sNiLcl
- Run the following eG Innovations PowerShell scripts on the eG Agent host:
- O365_Step2_ModulesDwnldnInstall.ps1
- O365SetRolesAndpermissions.ps1
- For more information from eG: https://bit.ly/2OneZaC
- For more information from Microsoft: https://bit.ly/3dutwK0
- Ensure the Microsoft Graph App is registered in Azure Active Directory (AAD) in order to monitor service health, Message Center communications and user activity.
- For more information from eG: https://bit.ly/3sNiLcl
During this initial setup running the PowerShell scripts mentioned above, you will set up an O365 monitoring user (eg. eGMonitor@domain.onmicrosoft.com) that you will then use to configure the various tests inside of eG, to complete the setup.
Test Configuration
Once you have completed configuration of all prerequisites, and running the PowerShell scripts, you will complete the configuration inside the eG Manager. Hop over to Admin->Tests->Specific Configuration

You will now see several new Component Types to select.
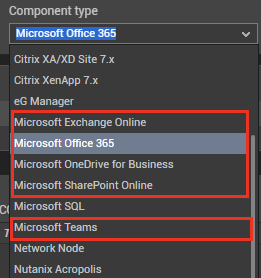
You will select these, your Agent and then Configure the “Unconfigured” tests for each service, as appropriate. Enter in the O365 monitoring user you setup while running the PowerShell scripts, and enter in its credentials. You will have to ensure this is configured for each O365 service, such as SharePoint, Teams, and OneDrive.
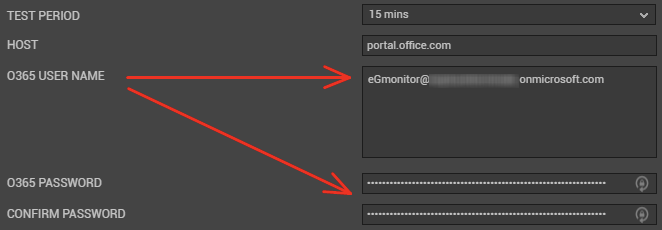
In addition to the configuration of these basic monitoring credentials, in order to test O365/Exchange Online mail delivery, a test account will need to be set up and configured, which has the ability to send and receive mail. This can be configured in the “Mail Deliverability” test inside Exchange Online. You will also need to verify that the SMTP port and SSL settings are correct.

Results
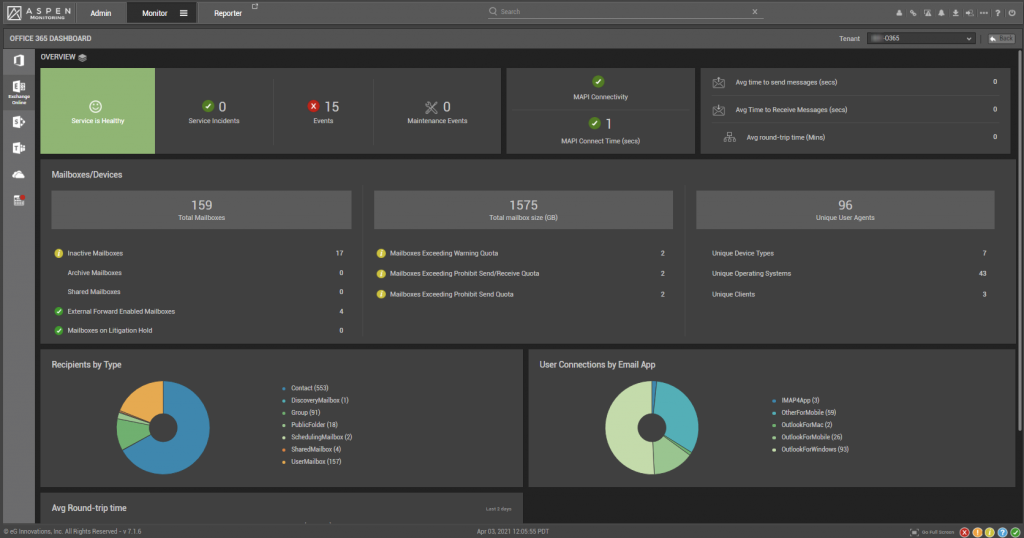
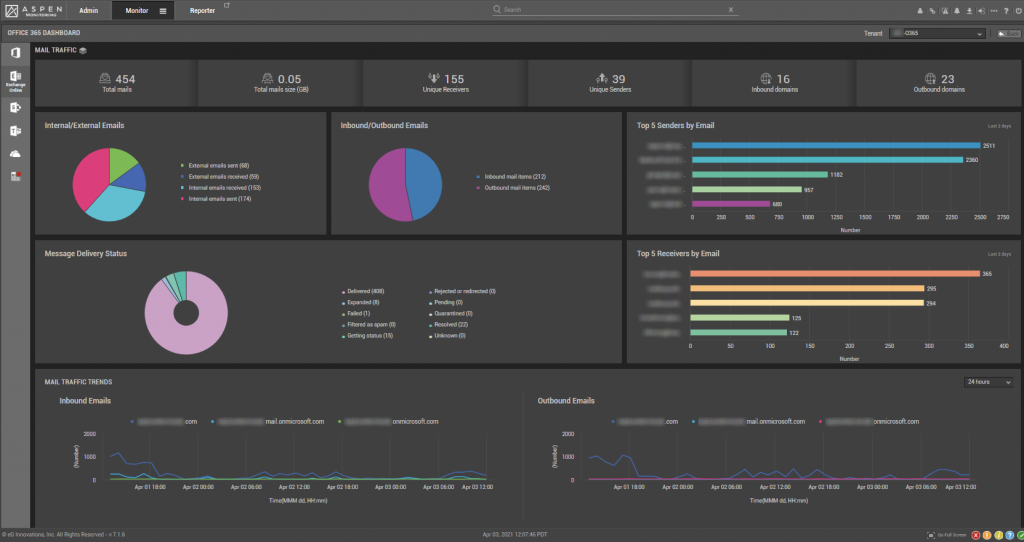
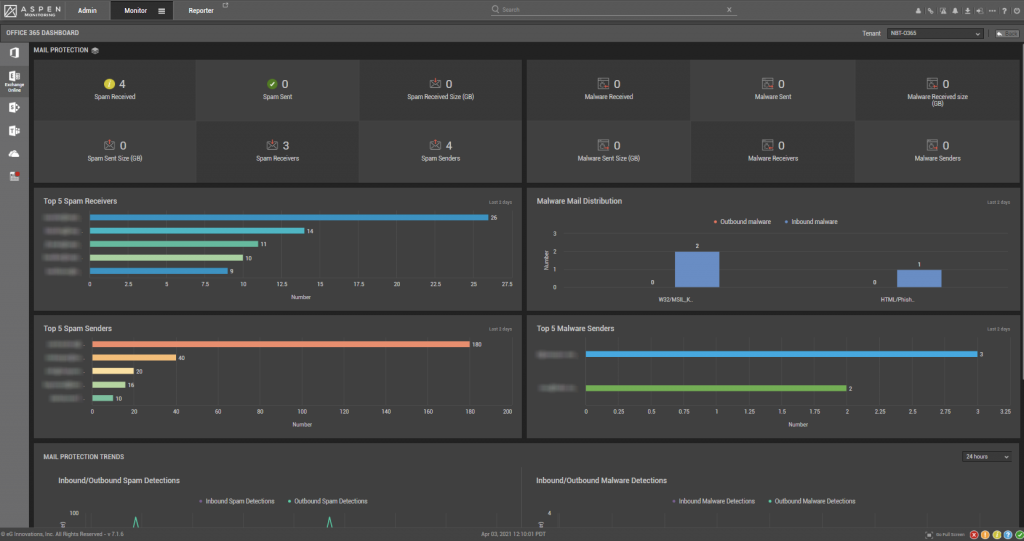
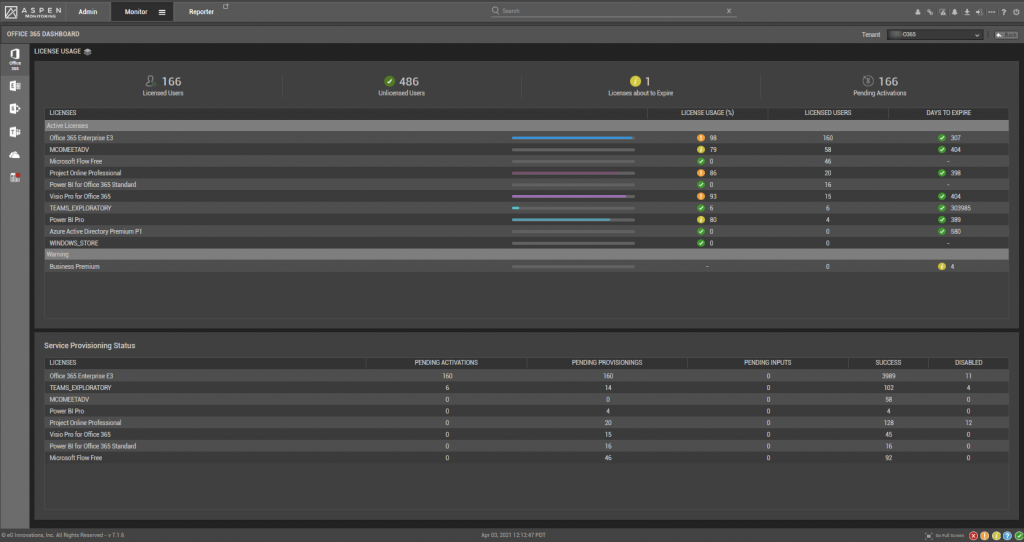
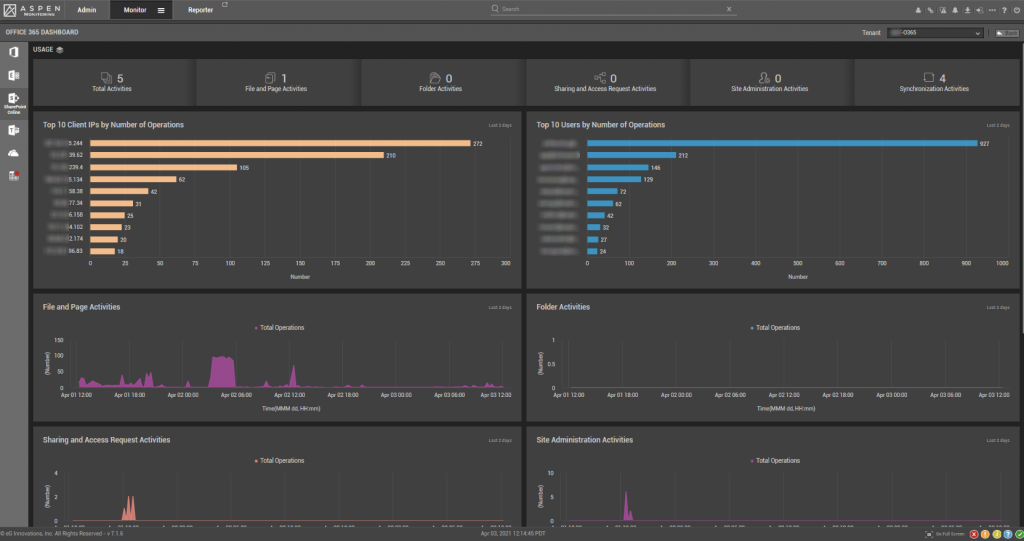
Once setup, you’ll have some pretty nice insight into exactly what is going on with your M365 services. Tests can have various polling intervals ranging from 15 minutes to 24 hours or more – but after letting all this run for a couple of days, you will start to see information populating your dashboards for each configured services. Here are some additional screenshots.
Exchange Online
Microsoft O365

SharePoint Online
Microsoft Teams
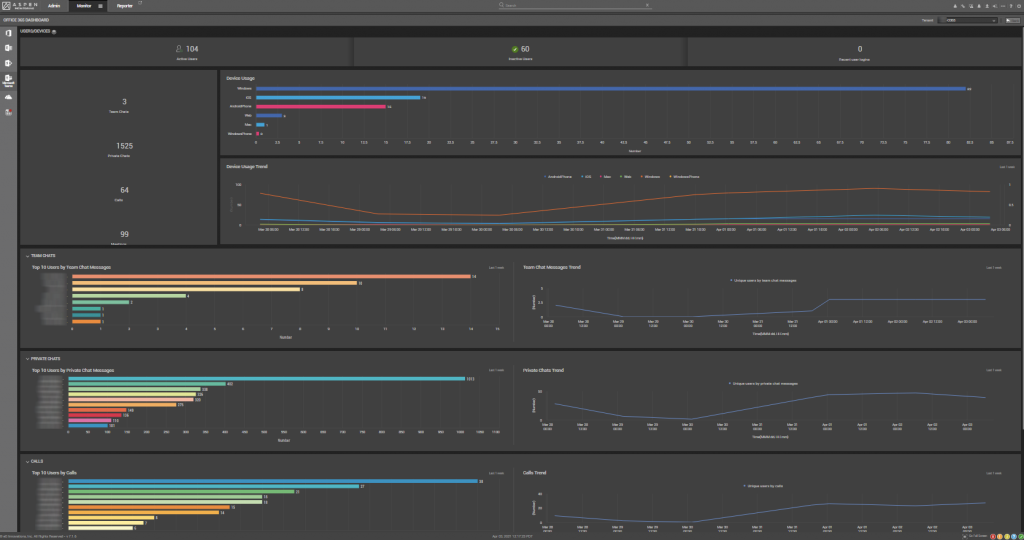
These are just a few screenshots of some of the dashboards available. Teams in particular has some other interesting statistics, such as Call Quality Analysis for audio and video streams – which will likely be another blog post in the near future.
We’re also not limited to these dashboards completely; we can also build our own custom dashboards containing these new monitored components, tailoring it to our needs – and evening publishing a dashboard to a single-click URL to share with colleagues and team members, which can be very handy indeed.
I hope this CribNote was helpful. Contact us if you’d like more information on eG Innovations, Microsoft M365, or virtualization support and solutions.


