


Last year, I posted a “Brief Visual Overview” of eG Innovations Enterprise, showing how this tool from eG can help you monitor your virtualized environment. This has been one of our more popular posts, so with the release of version 6.0 last August, I thought it was time for an update. There are a lot of improvements with v6. It comes with a big facelift and many new features.
In this post, I will try to give you a clear and concise summary of the eG monitoring system, show the layout, and how it can help you get your arms around the performance and health of your data center(s).
We have been spending a lot of time with this solution in the past year, so have had a chance to put the previous version (5.6) and this new version (6.0) through it’s paces.
Here’s what we’re going to cover in this post:
– Product Features
– What problems are we trying to solve?
– Focusing on the Layers of Service
– A Citrix Troubleshooting Example
– Product Overview
– Monitoring Home Screen
– Customizable Dashboards
– Business Dashboard
– User Experience Dashboard
– Viewing a History of Alarms
– Visual Styles & User Preferences
– Monitoring Geographical Zones
– Defining Segments and Services
Product Features
– Agent or agentless monitoring
– Simple single agent licensing model
– Extensive virtualization support
– Visibility of all virtualization layers enabling easy root cause analysis
– Historical reporting and graphs
– Automatic baselining and thresholding
– Real-time monitoring graphs & alarms
– Pre-emptive problem detection & alerting
– Customizable dashboards
– Uses HTTP/HTTPS for all monitoring, limiting need for VPNs for remote monitoring
– Configuration tracking & logging
– Automatic topology discovery
–  Much improved user interface
–  iOS & Android mobile apps
–  Improved customizable dashboards
–  Citrix and IT Executive dashboards
–  Enhanced reporting and monitoring features
–  XenMobile and ShareFile monitoring support
For a full list of what’s new with v6 see Release Notes: What’s New in eG Enterprise v6 (PDF)
What problem are we trying to solve?

With a large virtual environment, we collapse several layers and services together into clusters of physical hardware, but in the end, we are still managing networks, applications, services, and physical hardware. And, as before, we still have various system admins, SMEs, and network teams working independently of each other on their own systems and areas of responsibility.
Finding the root cause of a system slowdown can often be a daunting task. The Citrix Admin won’t have visibility into the network layer, an application SME won’t be aware of how the SQL database is performing, and often no one will know how the disk subsystem is truly performing.
So you start making phone calls, opening tickets and rebooting servers. Sound familiar?
Focusing on the Layers of Service
Regardless of how your mix of physical, virtual, cloud and on-premises components are configured and distributed in your organization, common service components exist. eG breaks down the health of each of these systems into easily-identifiable layers of service, color coded to quickly show you the health of each.
Common layers may include Windows Services, Network, Operating System, and others, such as application specific parameters. eG highlights these layers and each component within these layers with a common color code scheme, as follows:

Green = Healthy
Blue = Unknown Status
Yellow = Minor Issue/No Business Impact
Orange = Major Alert
Red = Critical
You can drill down on each one of these layers by opening each one up, and looking at specific performance details contained within the problematic layer. We’ll look at an example of this next.
A Citrix Troubleshooting Example
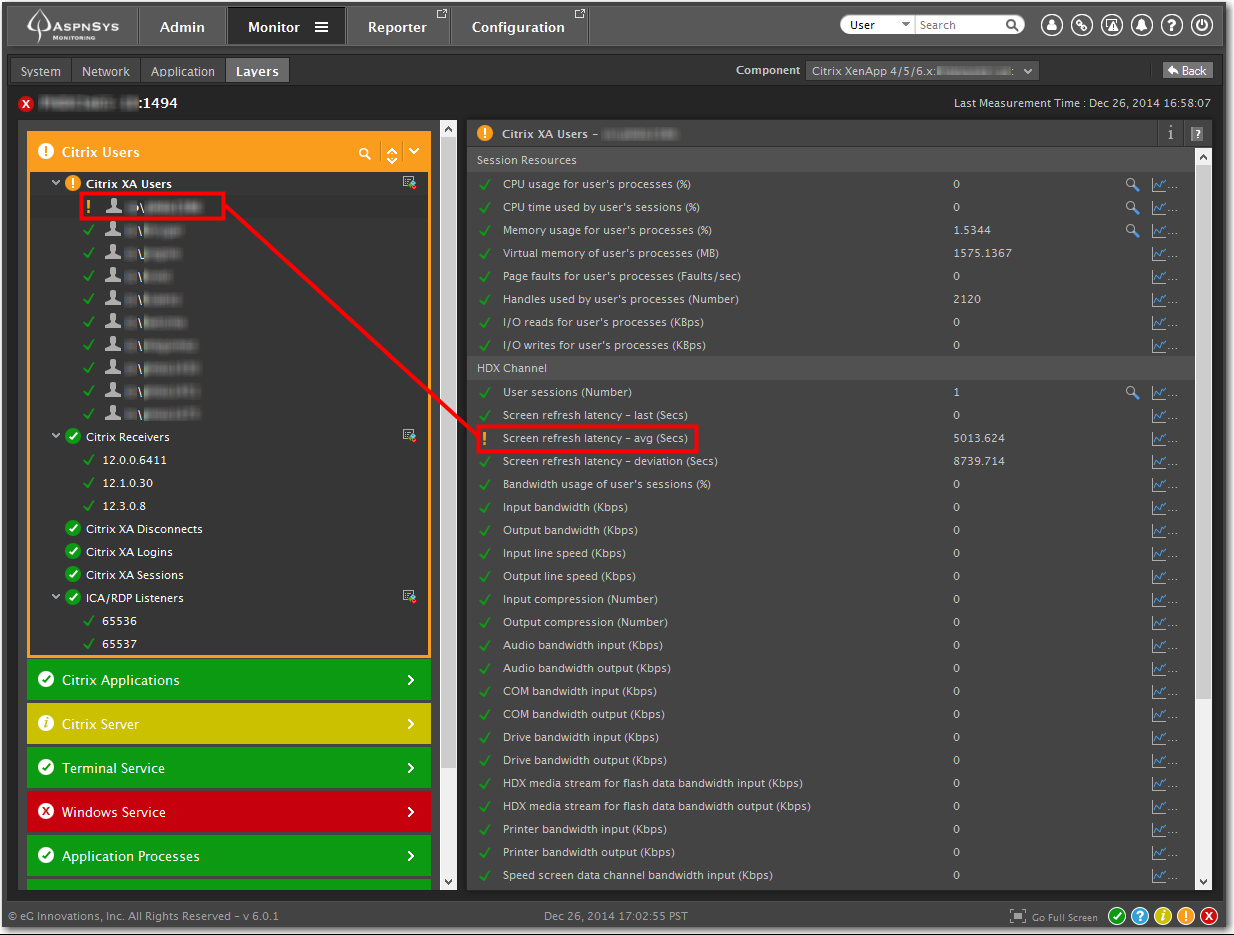
In this screenshot, I opened up the “Citrix Users” layer and found out what caused the layer to go suddenly from Green (all OK) to Orange (critical error). We can see a user logged into this particular Citrix server seems to be having some problem with Screen Refresh Latency, so their user experience may be suffering. As you can see, we have a wealth of other information available from the Citrix environment as well, including Citrix Receiver versions in use, HDX performance, XenApp logon, session, and disconnect status, and many others.
That’s a very quick example of how you can identify which layer is having the issue, and then drill down to find out the exact measurement that may be the root cause of the performance issue. These measurement thresholds can be adjusted to suit your environment and the subsequent alerts can be sent as notifications via email or SMS if those thresholds are exceeded.
Let’s have a look now at the rest of the system, to get a good overview of the rest of the system.
Monitoring Home Screen
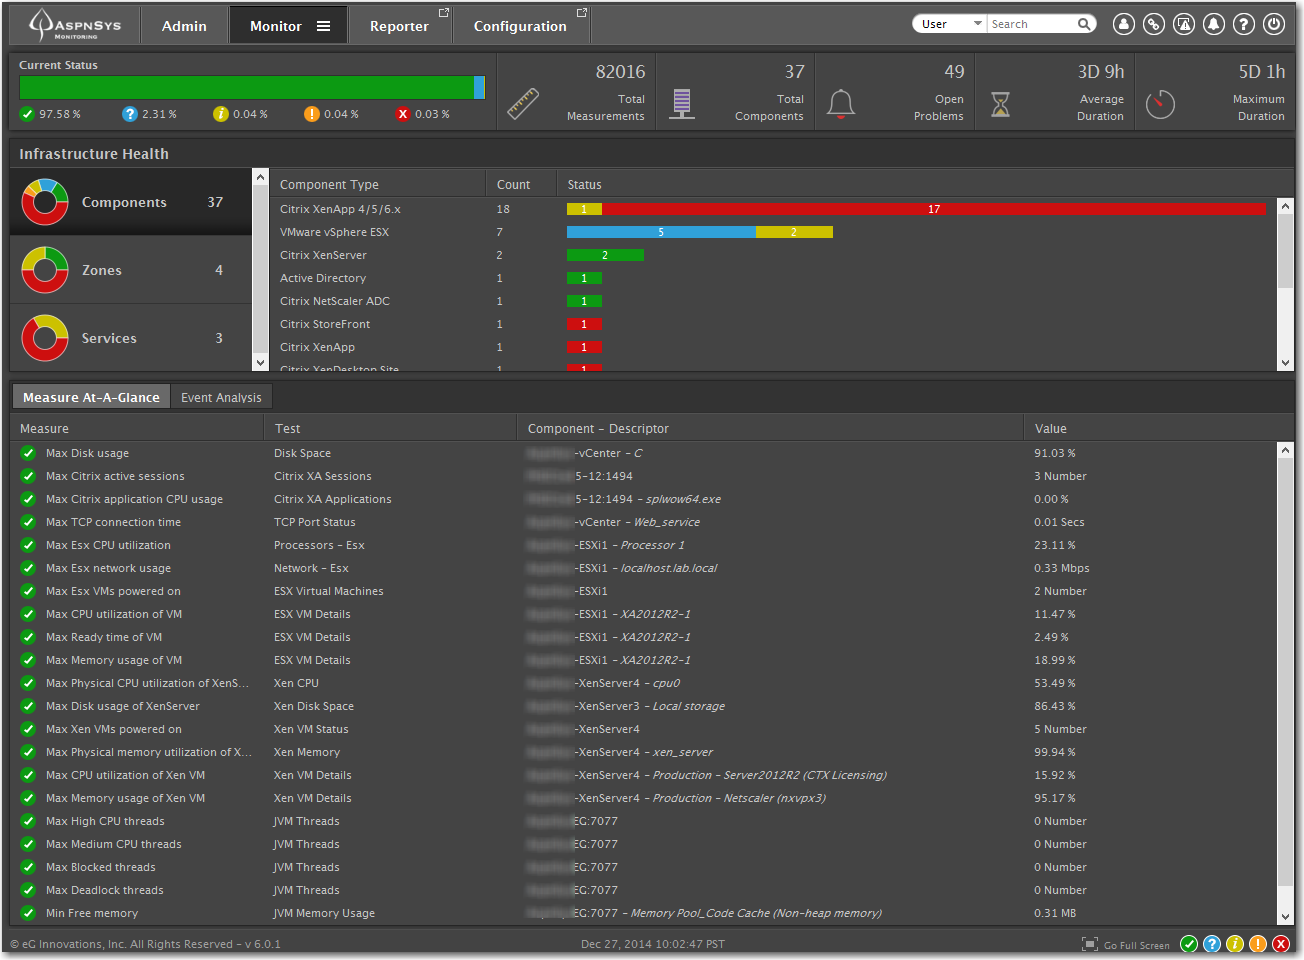
When you first log into the eG console, you default to the Infrastructure Health home screen, which gives you a birds-eye view of the health of your monitored infrastructure. The three primary sections of the eG system can be accessed by the above tabs (Monitor, Reporter or Configuration); Administrators will also see an additional Admin tab.
Along the top of the screen you see a quick summary of your environment, with overall summary statistics. Below that, we can see the health of each type of component. Components are a type of device, application or server. For example, typical components can be grouped as Citrix XenApp 4/5/6, XenApp 7.x, Citrix Netscaler, VMware ESXi, Microsoft SQL, a firewall, and so on. At a glance, you can quickly see how groups of these components are performing. From there, you can click on the color-coded component grouping and drill down to find the device measurement that is reporting performance problems.

On the left, you can change your view and target logical groups of devices. For example, instead of showing all Components in your infrastructure, you could select a logically defined geographical Zone, a particular Service, or a physical network Segment within your infrastructure. Some of these terms will be explained further below.
Customizable Dashboards

One area that eG has done a lot of work on in this release is the availability of nice, customizable dashboards. They have implemented a lot of customer requests here, and now each user can have numerous dashboards which can be private, or shared publically with their team.
Also, in order to help facilitate the availability and use of all this performance data, custom dashboards can be created and “published” to a URL. This URL can then be viewed by anyone, or perhaps on a large NOC display where your engineering team is located, without the need to log into the system, navigating to the appropriate dashboard, and selected, every time the data is needing to be viewed. You don’t have to worry about repeated and regular session timeouts, either. Nice!
The only trouble I’ve had here is with the precision of the formatting. I’m a bit of a neat freak when it comes to exact layout and I’ve found that sometimes the dashboard will not retain the exact layout I previously specified across eG Manager updates or when opened up with different browser window size settings. So at times, the panels need to be re-aligned and fiddled with. But if you are using a published URL to be executed at PC startup, for a NOC screen, where the screen resolution and browser settings are always the same, then most of the time you should be OK. I do think the exact position of the widgets are hardcoded nicely into the dashboard itself with v6.01, so the panel does a ‘best effort’ to adjust locations if the next browser window opened is a different resolution. If you maximize the window again to the exact resolution again, it should resolve itself. It seems my mileage has varied here a bit.
Business Dashboard
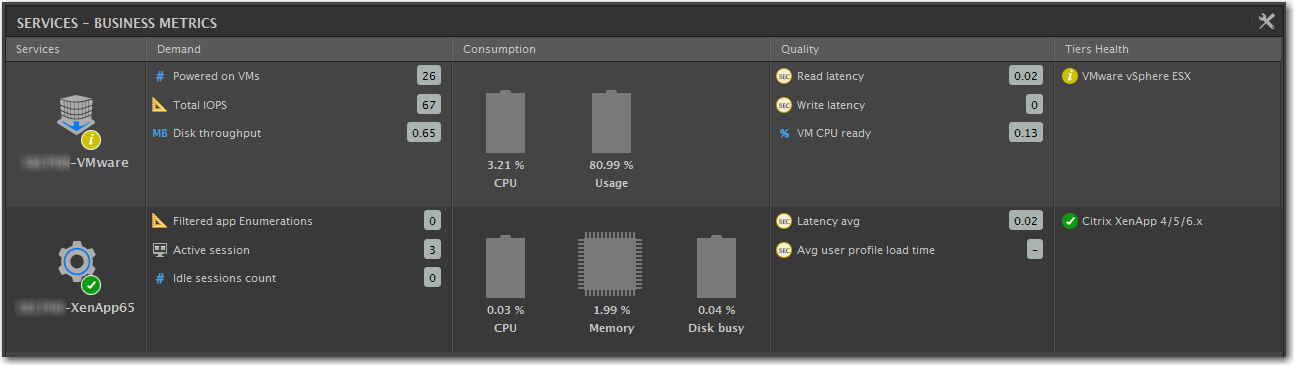
Another dashboard new with v6 is the “Business Dashboard”. This is aimed at satisfying the high level questions on how your environment is running for C-levels and Executives. It’s pretty easy to put together and gives a nice 30,000 foot view, highlighting the tiers of services, how they are preforming, an estimate of the quality of the service, and the overall consumption of resources. There are out of the box defaults here for Key Performance Indicators, but they are open to customization as well. Aspects of this display light up appropriately when thresholds or maximums are being approached.
Note: We’ve experienced some issues with this dashboard and the User Experience Dashboard when using Microsoft Azure SQL as the back end database. We worked with the eG technical team on this and a private fix was available within the week. So far things are looking much better. eG was extremely responsive and helpful throughout this troubleshooting process. Feel free to contact us or eG if you need assistance with this one.
User Experience Dashboard

Another new dashboard. This one gives you a nice overview of all active user connections in your Citrix XenApp or VDI environment. This could be helpful in identifying active users who may be having a bad user experience. You sort by any column to help find those outliers, and the columns you see below can be modified and customized by adding or removing fields of your choice. Working daily with XenApp and XenDesktop – I really like this one!
Note: We’ve experienced some issues with this dashboard and the Business Dashboard when using Microsoft Azure SQL as the back end database. We are currently working on resolving this issue with eG. Feel free to contact us or eG if you need assistance with this one.
That covers the most commonly used dashboards. There are some other dashboards and features in this area, but we may cover those along with more customization tips in a Part 2 of this blog in the coming months. I may also start to post the troubleshooting tips and gotchas as well in the near future. Stay tuned.
Viewing the History of Alarms
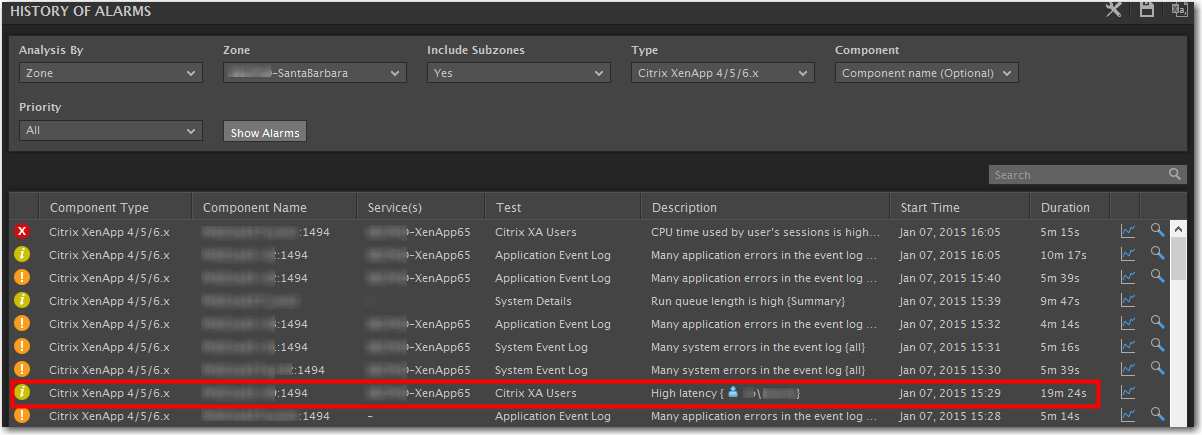
At any time, you can view a list of current and historical of alarms that eG has detected and reported on. It also keeps track of when alarms have been acknowledged or deleted, and by whom. If you acknowledge or delete alarms, and don’t solve the underlying root cause, they will simply occur again next time the scheduled test is run.
These alarms can also be sent to you or your administrators via email or SMS. To see how to turn on these delivered alerts, see the section below regarding User Preferences.

A nice documentation feature here is the keeping of a “Fix History” with information on when a fix was implemented, a description of what was done, and who performed the task. Nice way to tie in back end technical support ticket case #s.
Visual Style & User Preferences

I was never much of a fan of the previous user interface. IMHO, it was pretty visually unappealing and the layout took a lot of getting used to. The new interface is much, much better, with drop-down menus grouping related items into a layout that is logical and clear. There’s a lot less stumbling around trying to find things, and all screens are just visibly easy on the eyes. They did a very good job here indeed.
The small exception to this new look is the Configuration module (configuration/change tracking), which still has a touch of the old interface and looks somewhat out of place now. The nice top toolbar and drop down menus are still used when in this module, so it’s not too big of a problem. I expect eG will be updating this module soon so the UI is consistent across all modules.
 At the top of the menu bar, you can quickly perform a search for various types of elements including servers, services, VMs, desktops and users. To the right of this are a few handy buttons including access to your user profile preferences, theme settings, and default landing page. Other buttons include easy access to bookmarked pages, alerting preferences and contextual online help.
Managing Geographical Zones
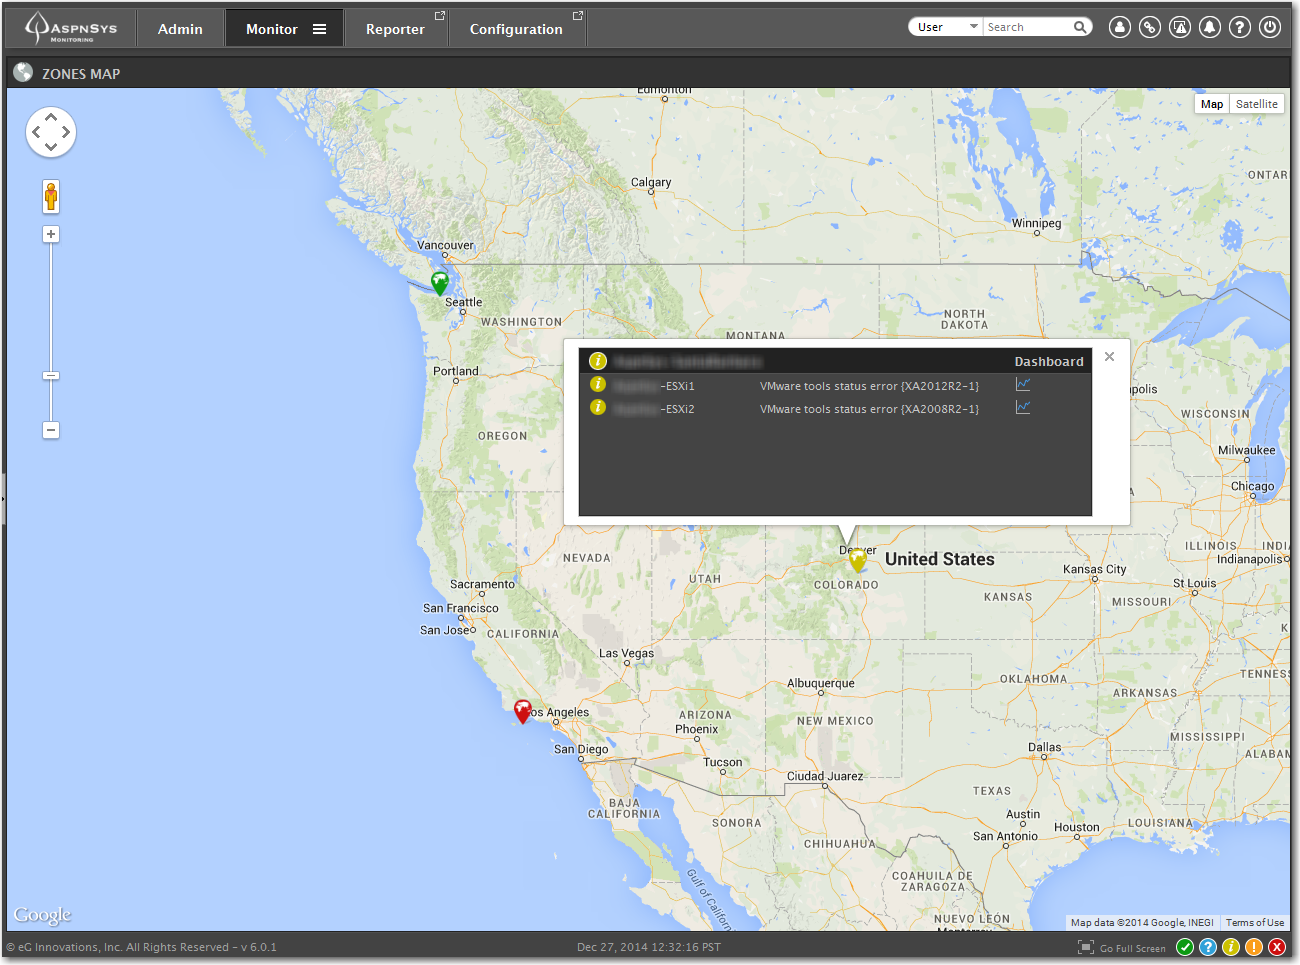
If your organization has multiple sites distributed across multiple locations, you can associate a geographical location or exact address to each, and them up on a Google map. Each location’s pin icon will be color coded to reflect the status of the Zone. You can mouse-over the Zone pin and all the components will be displayed with their associated status.
Defining Segments and Services
Two types of groupings in the eG system uses are Segments and Services. Segments can be thought of as (physical and/or virtually connected) segments or areas of your network that hold the resources you are monitoring. An example of this would be your VMware vSphere cluster, associated vCenter server(s), guest VMs running the infrastructure servers that are associated with this site and the many Services you may be monitoring. It also defines how all these are connected, and what dependencies are critical, so downstream status alerts can be generated.
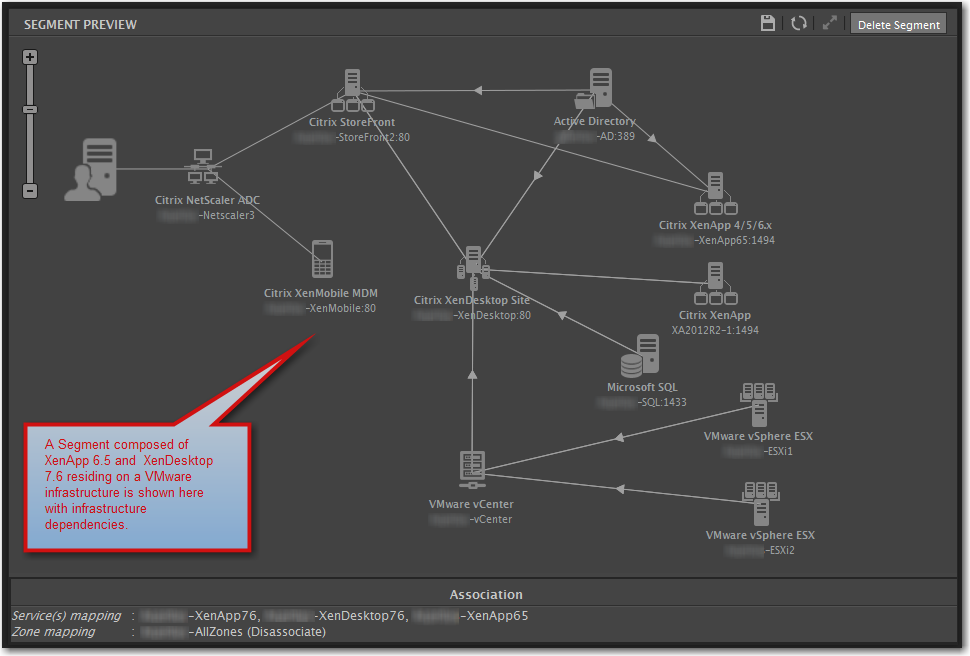
The screenshot below shows a segment that was built to represent many of the monitored services and how they are connected. You may notice that some lines have a small arrowhead attached to the segment. This indicates that the connection is required for the upstream service to function. For example, without Active Directory, StoreFront will not be able to authenticate users, so this connection is labeled as critical. If AD goes down, StoreFront can now be flagged as non-operational (in this case, Netscaler was not providing authentication so not line to AD was drawn). Alternatively, the connections from StoreFront to XenApp and XenDesktop were not flagged as critical, because if one went down, StoreFront would continue to be able to provide services to the other environment.
Once a Segment is defined, you can then create a more granular Service, and present that to the appropriate engineers or support staff who are responsible for these areas. The Segment above contains several services; Active Directory services, SQL/database services, VMware infrastructure, XenApp, XenDesktop, and XenMobile.
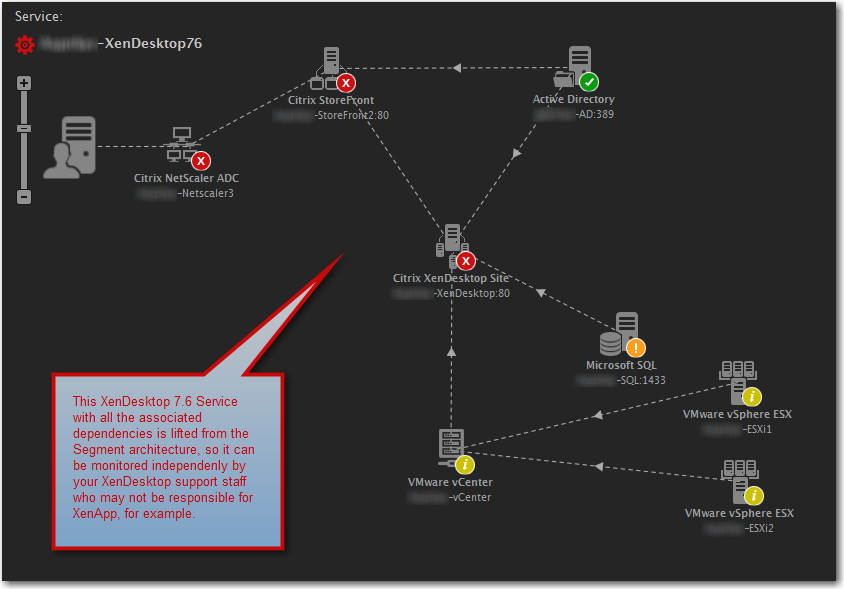
In the next screenshot, we’ve pulled the items above from the Segment and defined the following components as to what makes up the XenDesktop. This will allow our XenDesktop engineers to not have to worry about XenApp or any other unrelated infrastructure. We can also now view the color coded status of this architecture in the Service Topology view.

Once this service is defined, you can also view the granular details of the components in the Monitor->System area. The Key Performance Indicators (KPI) shown can be modified by using the “tools” icon in the upper right hand corner. This looks similar to the User Experience Dashboard, except is more infrastructure focused as opposed to user/session focused.
Summary
The team at eG has done an exceptional job with this release. For large enterprise environments, eG has always been a good fit due to the depth of its features. From a pure usability point of view I was hesitant to use it for smaller environments due to the complexity of the interface. It is now much easier to jump in and make sense out of all the data that is provided. The addition of new dashboards was a much needed feature that will assist both SMB and Enterprise customers alike.
Want a demo or a test drive? If you have any questions or want a demo, please contact us here. We can assist with both as an on-premises install, or delivering eG as a SaaS service.
Further Reading
Here are some additional links for further reading on the eG Innovations monitoring solution.
Key Features & Benefits
– eG Enterprise Key Features
– Feature Summary
– Value Propositions of eG Enterprise
New Features – v6
– Release Notes: What’s New in eG Enterprise v6 (PDF)
Platform Support
– Application Support
– Hypervisor Support
– Operating System Support
Demos, Videos & Presentations
– eG Enterprise Video Presentations (eginnovations.com)
– Request a Demo Account (our team here can provide a live demonstration and/or a demo account)
Previous ‘Brief Visual Overview’ Articles
– A Brief Visual Overview of eG Innovations v5.6
– A Brief Visual Overview of XenDesktop 7
If you would like more information on how Aspen Systems can assist you with monitoring and supporting your Citrix, VMware, or Microsoft environment, please contact us here.